
Centralized School Choice

Context
Just as Google and Amazon manage the information provided to users in order to generate value for consumers and sellers, school choice platforms provide these services for parents, students, and educational communities. In fact, centralized school choice and assignment platforms facilitate access to educational opportunities for students and families in over 50 countries worldwide. Recent studies show, however, that many users interact with these search and choice platforms with limited information and biased beliefs. This leads to inefficiencies and, in some cases, inequities in the resulting placements.
In Ecuador, families have historically been assigned to the closest public school based on household location as reported through the family’s electricity bill code, a process that was costly, inefficient, and inequitable. In Peru, families have historically applied directly to each school. In an effort to improve the system, both governments partnered with the IDB and information technology nonprofit ConsiliumBots to introduce parental choice through a centralized process.
Project
This paper studies the role of information about available options on school applications in a centralized school choice platform. We partnered with the Ministries of Education (MoE) of Ecuador and Peru to send “report cards” to applicants during the pilot phase of centralized school choice and assignment platforms. These report cards were given to a randomly selected group and included a list of suggested schools. We study the effect of this intervention on users’ subsequent application and enrollment decisions. We also collected survey data to evaluate the effect of our intervention on subjective measures.
Behavioral Barriers
Optimism bias: Optimism bias makes us underestimate the probability of negative events and overestimate the probability of positive events. Applicants’ beliefs on their chances of admission to a school informs their application strategy, and those beliefs are overly optimistic when we compare them with actual placement probability.
Lack of Information: People may lack relevant information, for instance, because information is difficult to obtain, scarce, or hard to understand. Applicants have limited information about their options, and learning about new schools is costly.
Behavioral Tools
Decrease of hassle factors: We frequently do not act on our intentions because of small factors or inconveniences that hinder us or make it uncomfortable. This could simply be the way in which the information is presented, its length, or that additional actions must be taken to execute a decision. In the context of this paper, providing a list of suggested schools greatly reduces the cost of school search by applicants.
Survey Design
First, we conducted an online survey to elicit participants’ beliefs about placement probabilities, their level of knowledge about schooling options, and the difficulty of the application process. The survey covered five aspects of the application process and was personalized for each applicant, taking into account the rank-order list (ROL) of schools submitted and the family’s home location. Specifically, questions were asked about applicants’ (1) perception of the application platform, (2) application strategy, (3) level of awareness of ranked and non-ranked schooling options, including on- and off-platform alternatives in the applicant’s neighborhood, (4) beliefs on assignment probabilities, and (5) satisfaction relative to hypothetical placement alternatives.
The universe of applicants assessed in Ecuador consists of around 4,000 children aged 3-5 (from pre-pre-kindergarten to kindergarten), with a balanced number of boys and girls. In total, 3,984 applicants submitted a rank-order list for the 2021 admission process. The average length of the final portfolios was 1.9 schools. The universe of assessed applicants in Peru for both years includes around 11,700 families with children aged 3-6 (from pre-kindergarten to grade 1), with a balanced gender ratio. Exactly 6,876 applicants submitted an ROL in the 2021 intake, while 4,856 applicants did so in 2022. The average length of the ROLs submitted was 3.3 schools, and around 40% of the families applied to schools in the largest district.
Randomized Control Trial (RCT) Design
Given the results of the survey, we also study the causal effect of information provision in the regions of Manta, Ecuador and Tacna, Peru, both of which were implementing a centralized school choice system for the first time. These pilots offered a unique opportunity to test the same policy design in different contexts. In both pilots, parents applied to schools using an online platform, and the educational authorities then assigned students to schools using a deferred acceptance (DA) assignment mechanism.
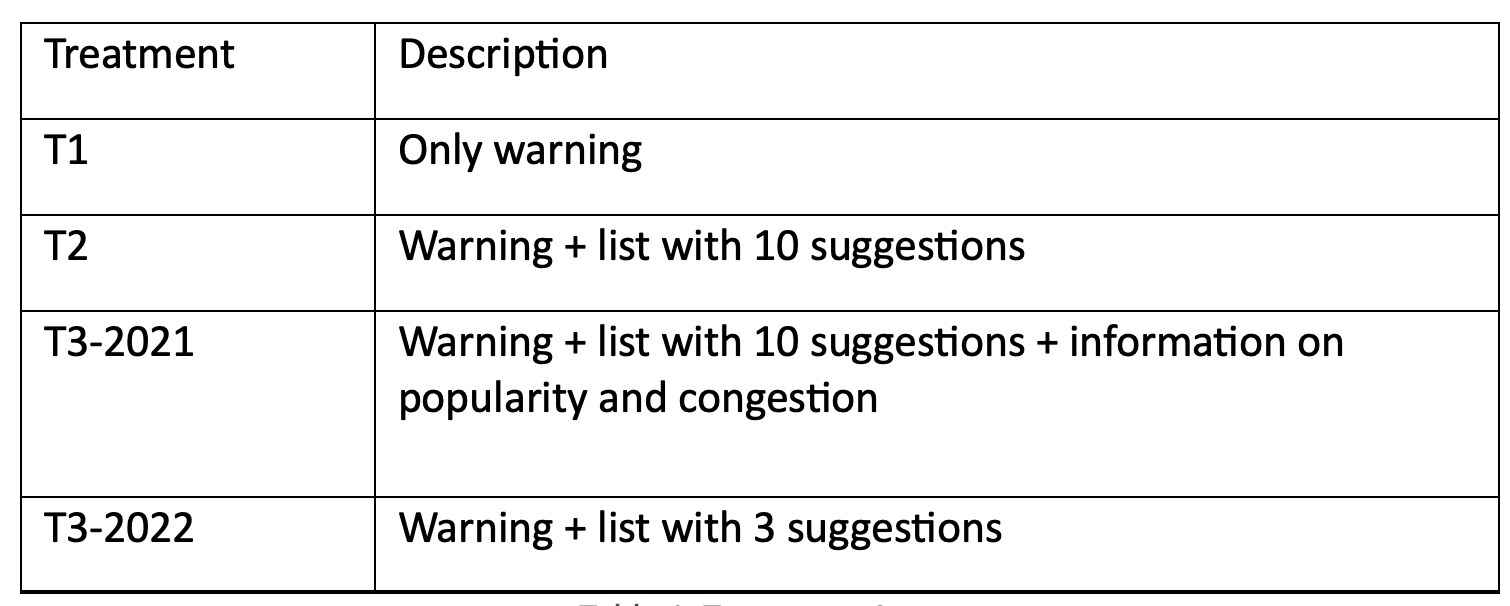
We designed three report cards to test the effect of different levels of detail (Table 1). The first report card only included the current application, a warning about the placement risk, and a general recommendation to add more schools. On the second report card, we added a personalized list of 10 schools that parents did not consider in their initial portfolio. The third report card differed between the 2021 and 2022 implementations: in 2021, we included a personalized list of 10 schools plus information about the popularity and congestion of each school, the most comprehensive report card we delivered. In 2022, this report card only included three schools with no extra information on popularity or congestion. The proxies for popularity and congestion are based on the number of applications from the same district as well as the number of applicants and open seats available. For instance, the minimum number for a school to be considered “popular” was the number of applications received by the most demanded school with some available seats.
We randomly assigned applicants to one of the three treatment arms (Table 1). Between 4 and 7 days before the last day of the application process, we identified the students with a positive non-placement probability—i.e., risky applicants—and sent them a link to the report card by email and through WhatsApp. In Peru, we implemented the intervention during the 2021 and 2022 intake years, and applicants also received an additional WhatsApp message with a non-placement warning. In Ecuador, the intervention was conducted only during the 2021 admission process, and we did not send the non-placement warning via WhatsApp.
Table 1: Treatment Arms
Challenges
- For the survey results, only 32% percent of families completed the survey, and they are more likely to come from the largest urban areas.
- The interventions were not exactly the same in both countries—arguably the likely cause of most of the differences in the outcomes. In Ecuador, the warning related to placement risk was not sent as a separate message via WhatsApp; it was only included on the report card. Applicants in Peru received a specific WhatsApp warning message, which was also included in the report card.
- Since we did not randomize the allocation of popularity or congestion information, we are not able to differentiate their particular effects.
For the Ecuadorian context, we cannot rule out a zero effect on the shifting of preferences.
Results
Survey Results
Our survey results show that applicants are overly optimistic in terms of placement probabilities and that their awareness of the available options is very limited. We also observe that families have a strong desire to be placed, and that finding out more about a given school is hard. Applicants with a positive probability of non-placement hold a belief about their admission chances that is around 30 percentage points (pp) higher than the actual probability, i.e., a considerable optimism bias.
Figure 1. Optimism on Placement Probability
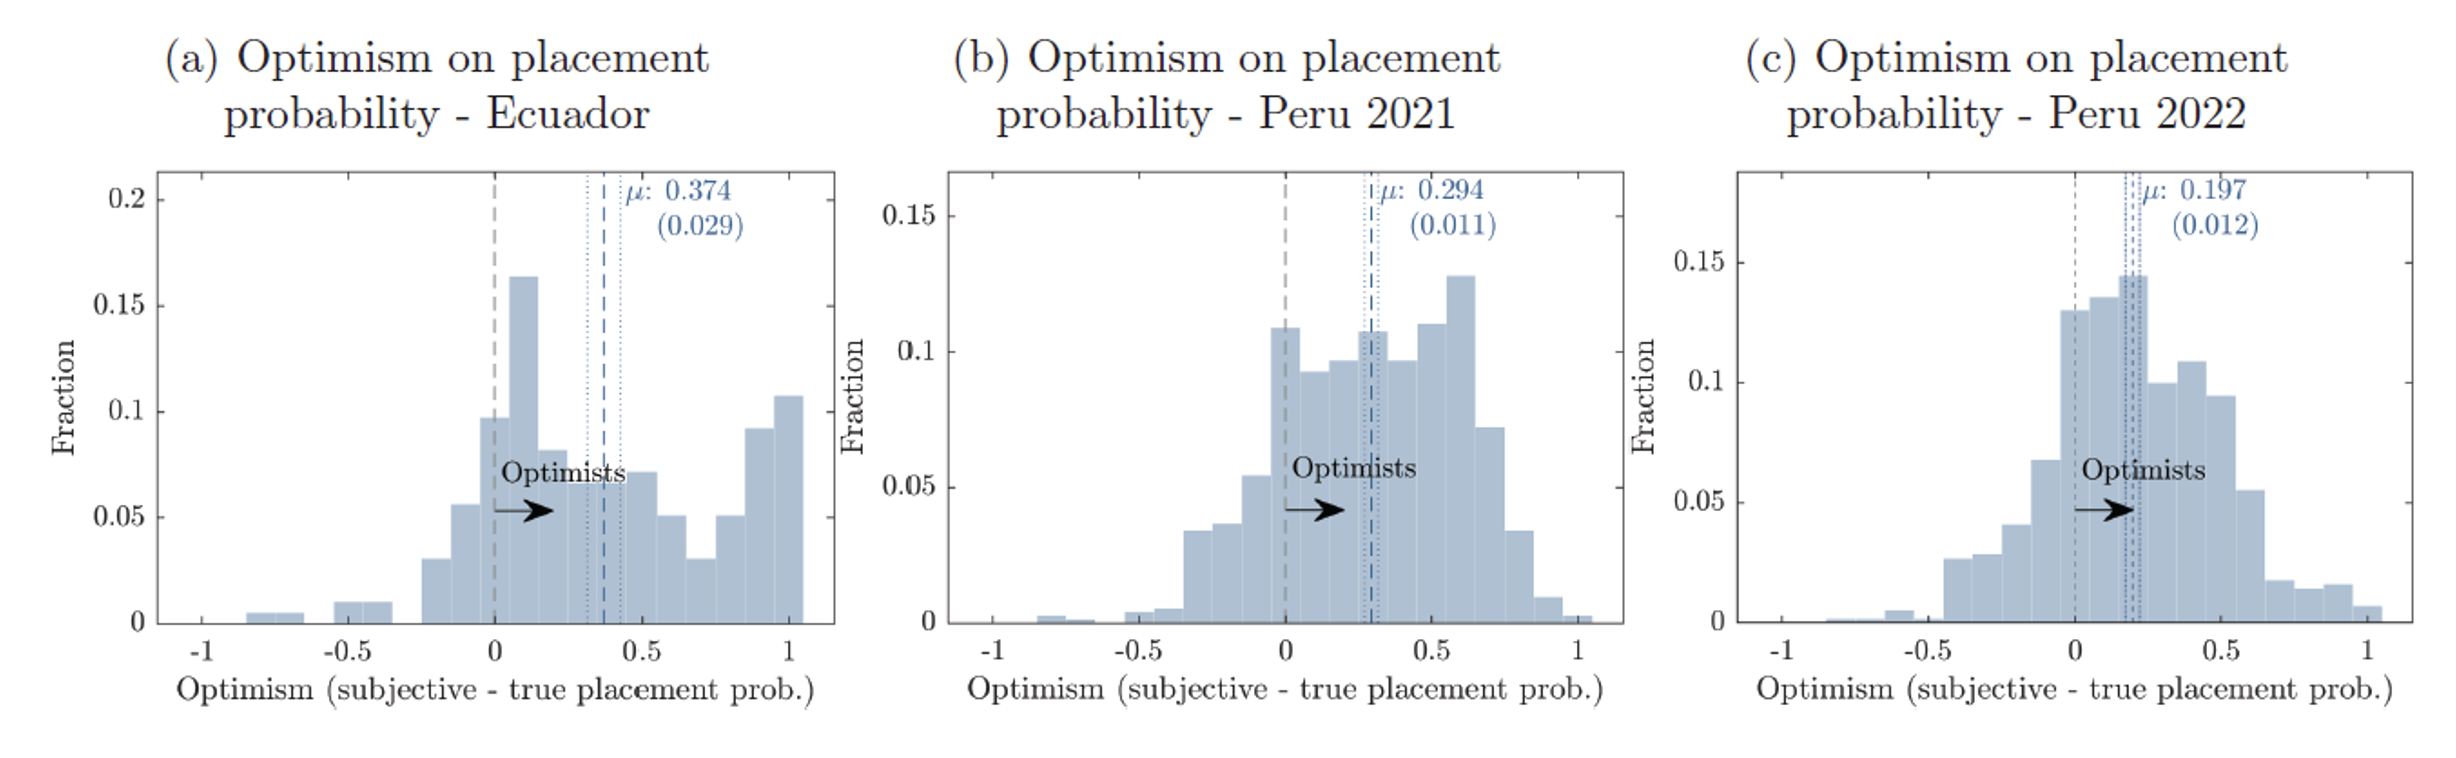
In Ecuador, an average applicant thinks that her child’s chances of being placed in at least one of the options in her ROL are 37pp higher than the true likelihood (Figure 1). In Peru, this optimism is 29pp and 20pp in 2021 and 2022, respectively (Figure 1). Additional survey components show that families have an imperfect understanding of the deferred acceptance assignment mechanism. This is reflected in their declared strategies, which neither benefit their application nor the stated effects on their beliefs from hypothetical strategies. Applicants do not necessarily infer that a popular school is a good school and have very limited knowledge about private options.
Intervention Results
Our intervention results show that applicants that received the treatment with school suggestions were more likely to add those schools compared to applicants who received the report card with no suggestion list. Meanwhile, adding additional information on popularity and congestion does not affect the probability of adding a school. We test the causal effect of providing school suggestions on a sample that is restricted in two ways applicants with i) elevated placement risk and ii) who subsequently opened the report card with the non-placement warning sent to them.
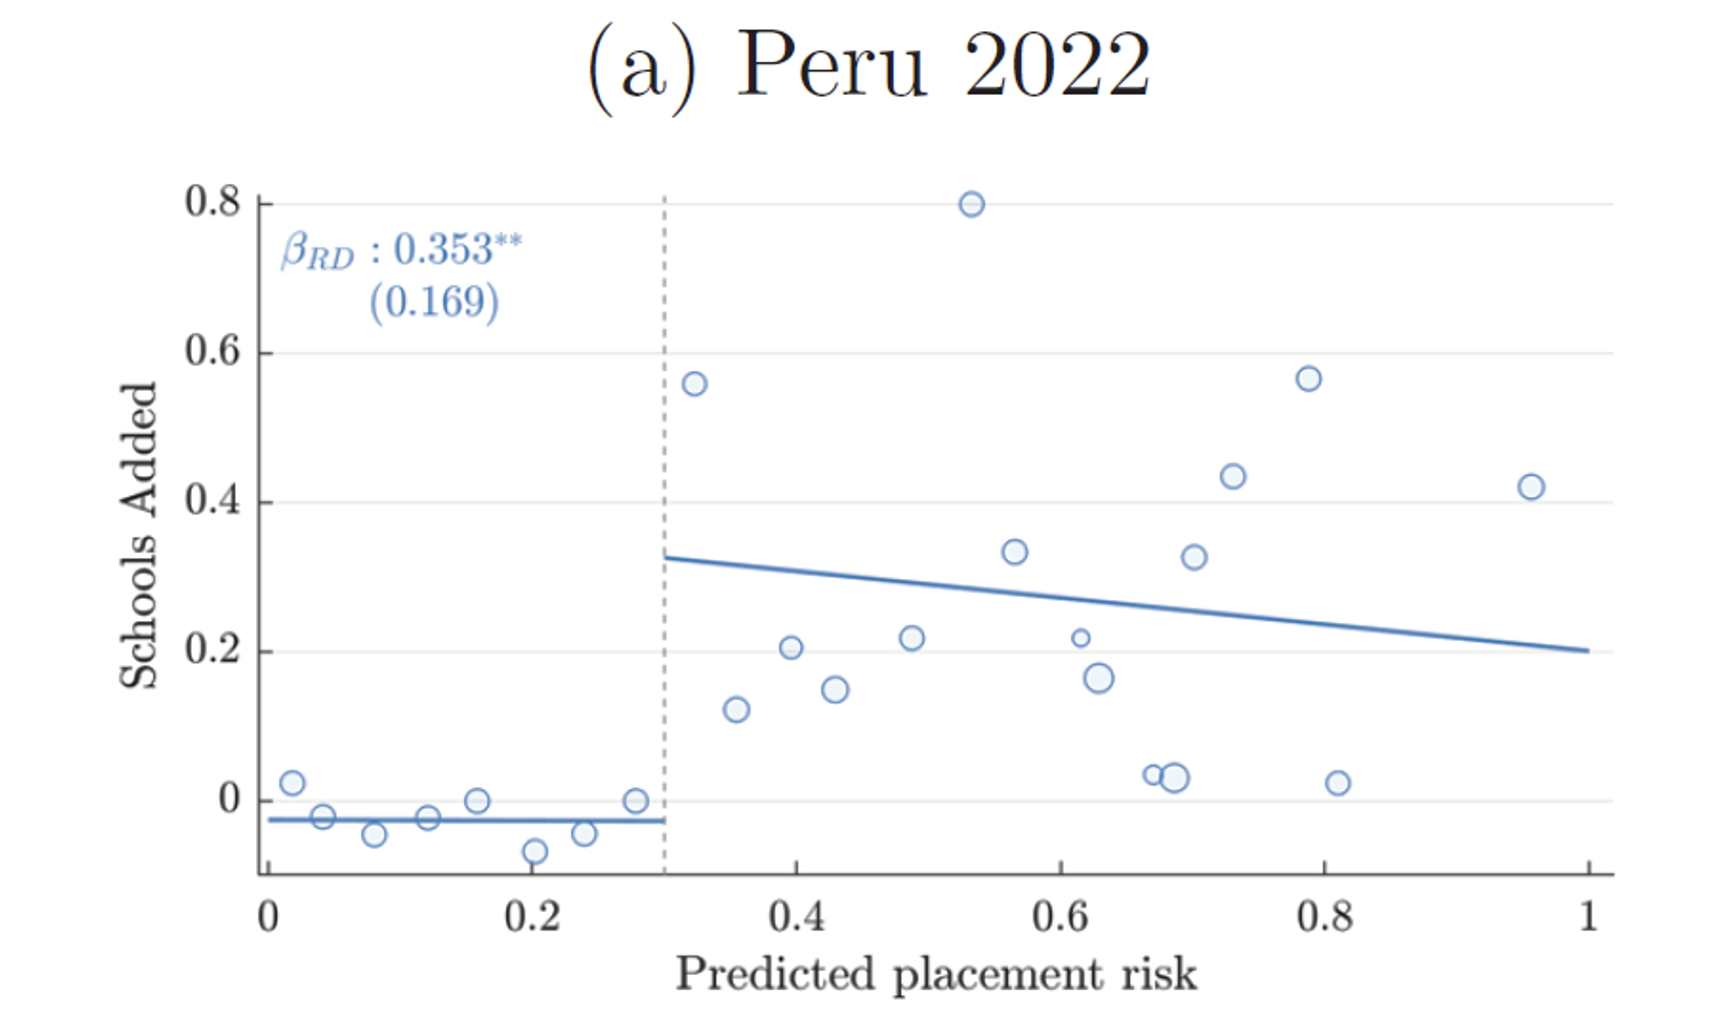
Firstly, we document that the warning affects parent behavior. Figure 2 shows the regression discontinuity plots for 2022 Peru where the horizontal axis represents the predicted placement risk (probability of non-placement), the metric used to assign the warning message in both contexts. Only applicants with a risk level higher than 30% received a warning. We observe a discontinuous behavior, reflected in applicants to the right of the threshold adding more schools.
Figure 2. Regression Discontinuity, Schools Added
Second, we focus our analysis on the differential behavioral response between applicants who received the suggestion list of ten schools (T2) and those who did not see such a list on the report card (T1). Since we implemented T2 in all three contexts, we can pool the individual samples to calculate aggregate results:
- We observe a marginally significant effect on the number of schools added. Applicants who receive the lists add 23% more schools to their list on average.
- Students assigned to T2 are more likely to include schools from the list. When we do not show the list, 12% of families add a school from what could have been their list. When the list is shown, 19% of applicants add at least one suggestion.
Now we look at the results by implementation country/year. In this analysis, we consider the effect of T3 treatments that are specific to each implementation year.
RCT Results: Ecuador
- In Ecuador, 10% of the applicants who opened a report card with a non-placement warning added at least one school to their list.
- On average, these families extended their portfolios by 2.4 schools. However, there is no statistically significant effect of providing school suggestions in the context of Ecuador.
RCT Results: Peru 2021
- One third of the families that opened our link added a school to their application where there was a statistically significant differential effect between applicants assigned to T1 treatments and treatments with suggestion lists.
- Applicants who received the school suggestion list (T2 and T3−2021) were more likely to add a school from the list. The proportion of applicants who added schools from the list was 68% higher in T2, and 51% higher in T3.
RCT Results: Peru 2022
- Suggestion lists of varying lengths have an effect: T2 increased the proportion of families that added schools from the list by 120%, the same absolute magnitude as the effect of T3−2022.
- The proportion of applicants that added a new school to their portfolio increased by 49% when they were assigned to the list of three suggestions compared to when they did not receive it.
Policy Implications
- When searching for schools is costly and applicants hold biased beliefs, new information can lead applicants to increase the number of schools added to their lists and can shift their preferences towards the suggested schools.
- Communication channels and content matters. Where it was possible to communicate through WhatsApp, the messages were more effective than by email. Results also suggest that it is better to provide information using more than one channel.
- Understanding the local context together with effectively designing platforms and carefully selecting the information they contain can shift search and choice behavior and should be seen as important aspects in the creation of centralized choice policy.